
Graphic Arts Employment Down in July

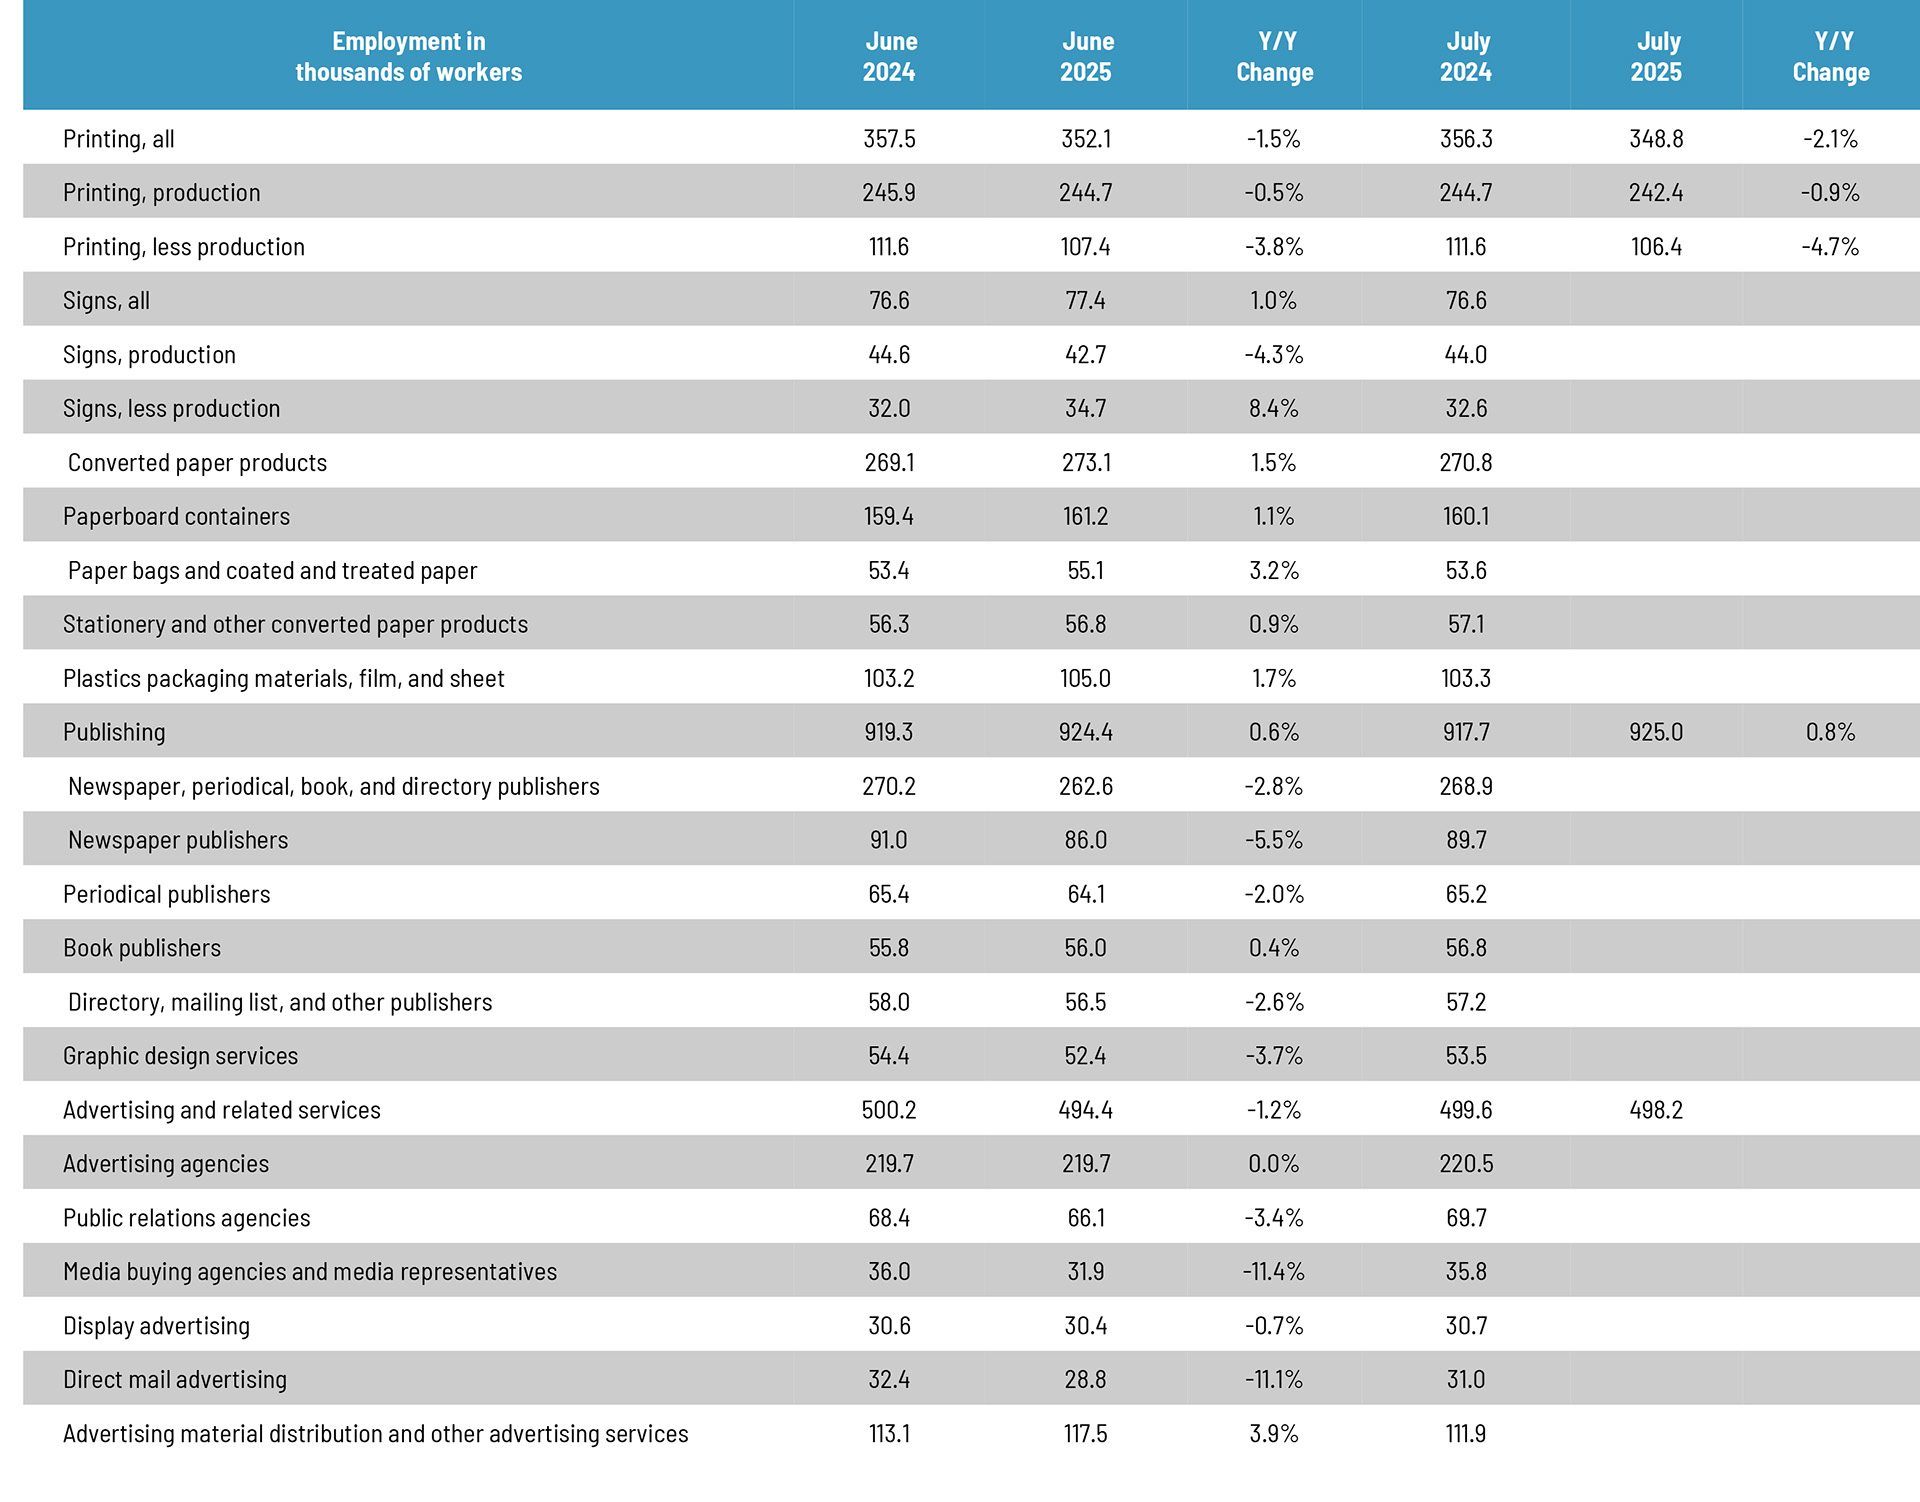
Throughout spring 2025, printing employment has been generally flat, but started to decline as we headed into summer. Net printing employment in July 2025 saw printing industry employment decline 0.9% from June—overall, production employment was down 0.9% and non-production employment also down by 0.9%. (At least it’s consistent!)
Publishing employment was Up 0.1% from June to July.
Looking at other business categories, the reporting of which lags a month:
Overall employment in the signage industry was up 1.3% from May to June 2025, with sign production employment up—wow—2.4%, and non-production unchanged.
Converted paper products employment was up 0.3% from May to June, with paperboard container employment up 0.4% and paper bags and coated and treated paper employment up 0.2%.
Looking at some specific publishing and creative segments, from March to April, periodical publishing employment was down 0.6%, while newspaper publishing employment was up1.2% and book publishing was up 0.5%. Graphic design employment was up 1.2%, ad agency employment was up 0.4%, and PR agency employment was up 1.5%. Direct mail advertising employment was up 1.4%.
As for July employment in general, the BLS reported on August 1:
Total nonfarm payroll employment changed little in July (+73,000) and has shown little change since April, the U.S. Bureau of Labor Statistics (BLS) reported today. The unemployment rate, at 4.2 percent, also changed little in July. Employment continued to trend up in health care and in social assistance. Federal government continued to lose jobs.
…
Revisions for May and June were larger than normal. The change in total nonfarm payroll employment for May was revised down by 125,000, from +144,000 to +19,000, and the change for June was revised down by 133,000, from +147,000 to +14,000. With these revisions, employment in May and June combined is 258,000 lower than previously reported.
By the way, it’s worth mentioning that when the BLS and other statistical agencies make “revisions,” they’re not correcting errors. The original data is not faulty. Rather, they revise the numbers as more information becomes available—that is, as more companies respond to the BLS. Many companies—especially smaller ones—tend to put off responding longer than larger companies do. So as more data comes in, the numbers are revised up or down. It’s like Election Night, when early in the evening few precincts have reported in but, by the end of the night, more data has come in and winners and losers can be more accurately projected.
Moving on…
The U-6 rate (the so-called “real” unemployment rate which includes not just those currently unemployed but also those who are underemployed, marginally attached to the workforce, and have given up looking for work) increased from 7.7% to 7.9%
The labor force participation rate decreased in May from 62.3% to 62.2% and the employment-to-population ratio decreased from 59.7% to 59.6%. The labor force participation rate for 24–54-year-olds decreased from 83.5% to 83.4%.
The July report was below economists’ expectations, and the steep downward revisions in May and June payrolls are concerning. (You may recall that this was the jobs report that caused the head of the BLS to get fired.) Spoiler alert: the August jobs numbers came out last week and they’re also not very good.
link


